📊 Week 6: Rainfall Graph Analysis - Waikato Region
Unit 10: Kai, Culture and Climate — Surviving Scarcity
Analyze rainfall data for the Waikato region and connect it to food production and scarcity.
📈 Graph 1: Annual Rainfall - Waikato Region
Draw or paste a rainfall graph here
Source: NIWA Annual Climate Summary 2024
[Graph Space]
Label: X-axis (Years), Y-axis (Rainfall in mm), Title, Data points
2024 Data from NIWA:
- Dargaville (Northland): Driest year on record
- Whitianga (Coromandel): Driest year on record
- Bay of Plenty & Coromandel: Below normal (50-79% of annual normal)
- Waikato region: Check NIWA data for specific locations
Source: NIWA Annual Climate Summary 2024
📊 2024 Climate Data from NIWA
Key Findings from NIWA Annual Climate Summary 2024:
- 2024 was New Zealand's 10th-warmest year on record (0.51°C above average)
- Dargaville and Whitianga: Driest year on record
- Lumsden (Southland): Wettest year since records began (1982)
- Drought conditions: Northland, Taranaki, Manawatū-Whanganui, Wairarapa, Wellington, Marlborough, Tasman, and Nelson
- Four state of emergency declarations: Westland (Jan & Nov), Wairoa (June), Dunedin & Clutha (October)
Source: NIWA Annual Climate Summary 2024
1. Basic Observations
What is the average annual rainfall for the Waikato region? (Research from NIWA data)
According to NIWA 2024 data, was rainfall above, below, or near normal for your region?
Is there a trend? (Is rainfall increasing, decreasing, or staying the same over time?)
2. Patterns & Extremes (Using 2024 Data)
2024 had extreme events. Which regions had very high rainfall (flood risk)?
Which regions had very low rainfall (drought risk) in 2024?
How do these extremes connect to food production and scarcity?
3. Connection to Food
How does high rainfall (flooding) affect food production in the Waikato?
How does low rainfall (drought) affect food production?
What does this mean for food scarcity?
📈 Graph 2: 2024 Monthly Rainfall Anomalies - Aotearoa New Zealand
NIWA 2024 Monthly Rainfall Anomalies Map
Source: NIWA Annual Climate Summary 2024
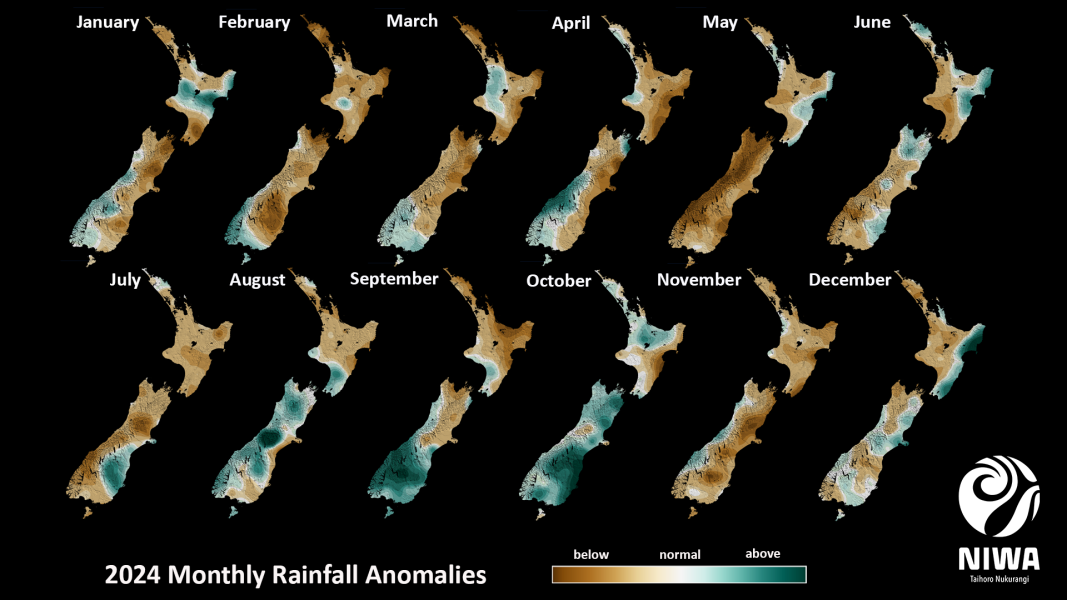
Legend: Brown/Orange = Below normal • Beige = Normal • Teal/Blue = Above normal
📊 Analysis Questions:
- Which months had the most widespread below normal rainfall? What regions were affected?
- Which months had above normal rainfall? Where did this occur?
- What pattern do you notice between the North Island and South Island?
- How does this connect to the state of emergency declarations (Westland, Wairoa, Dunedin & Clutha)?
[Space for your analysis notes]
Record your observations about the monthly patterns
🤔 Final Analysis: Connecting 2024 Data to Food Scarcity
Based on NIWA's 2024 Annual Climate Summary and your graph analysis, answer:
-
2024 had both extreme droughts AND floods. How did this affect food production?
Think about: Dargaville (driest year), Lumsden (wettest year), state of emergency declarations
-
NIWA reports that 8 of New Zealand's 10 warmest years have occurred since 2013. What does this trend mean for food production and scarcity in the future?
-
How does the 2024 data connect to our unit's Big Question: "What Will We Eat Tomorrow?"
Consider: What happens to food when there's too much rain? Too little? How do farmers adapt?
- Compare your region's 2024 data with other regions (e.g., Dargaville vs. Lumsden)
- Research how the 2024 drought affected specific crops or farms in your area
- Investigate how farmers adapted to the extreme weather in 2024
- Download the full NIWA Annual Climate Summary 2024 PDF for more detailed data